Logstash, Sentinel, Round Two….
On 9th November Microsoft released a new connector for Logstash and, as we very recently detailed how to get data flowing from Logstash to Azure Log Analytics, we thought this new functionality should be addressed.

If you don’t have Logstash already configured in your testing environment take a look at our previous post as this will get you quickly up and running, in fact we’ll be basing this overview on modifying the existing setup.
The full post/how-to from Microsoft can be found here.
Logstash Configuration
To start, the new Microsoft Sentinel plugin will need to be installed. As previously mentioned, this overview assumes you have an existing Logstash configuration.
sudo /usr/share/logstash/bin/logstash-plugin install microsoft-sentinel-logstash-output-pluginBefore data can be sent to Microsoft Log Analytics, an output filter needs to be created that creates a sample file. This sample file collects up to 10 records and from these a JSON file is created that can be uploaded to Azure Monitor to define the table schema (more on this soon).
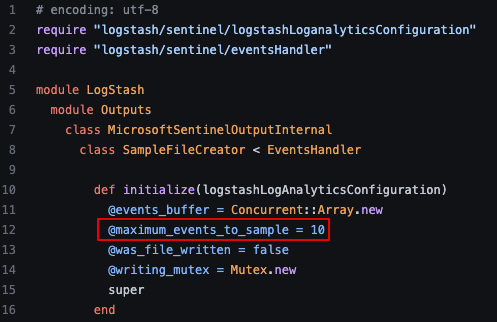
It’s worth noting that a hard limit of 10 records is configured in the file sampleFileCreator.rb which can, for testing or experimentation purposes, be modified if you wish to collect more records. This may be needed in edge cases where you need to validate records from multiple sources all match the expected format, for example.
The Logstash output filter.
output {
        microsoft-sentinel-logstash-output-plugin {
                create_sample_file => true
                sample_file_path => "/tmp"
                }
      }
Restart the Logstash service, wait for the JSON file to be created (under /tmp in this example) and then transfer the file from the server as it’ll soon be required.
sudo systemctl restart logstash.service
App Registration
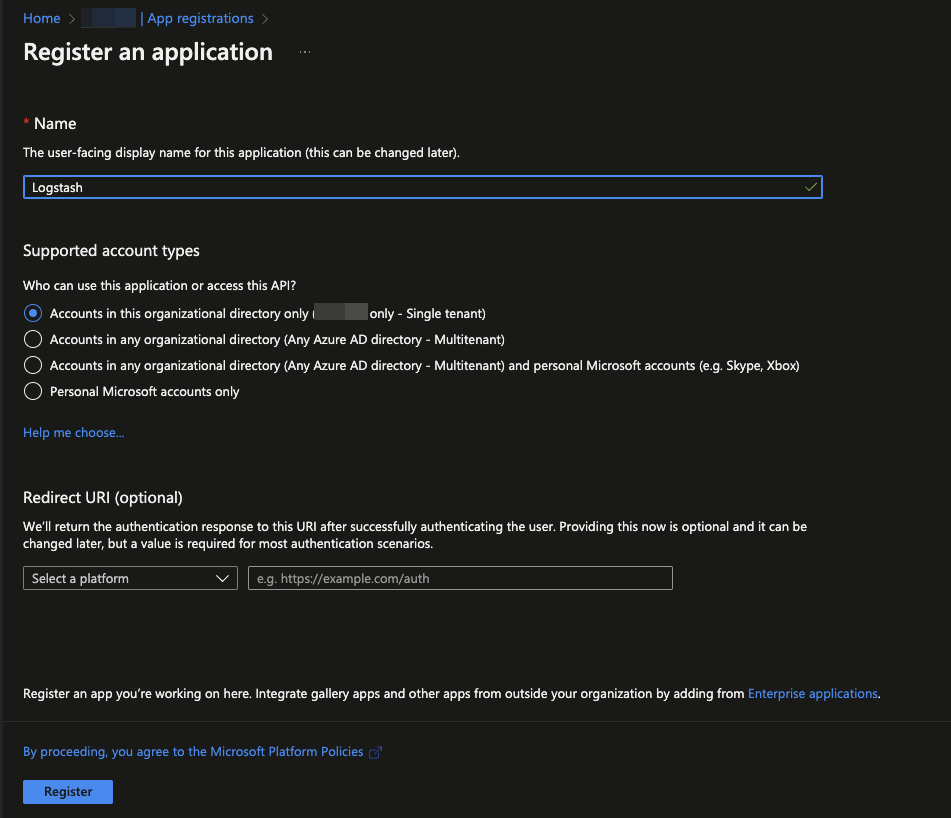
A new App Registration will need to be created from Microsoft AAD.
Navigate to AAD > App Registration > New Registration and give the application a meaningful name.
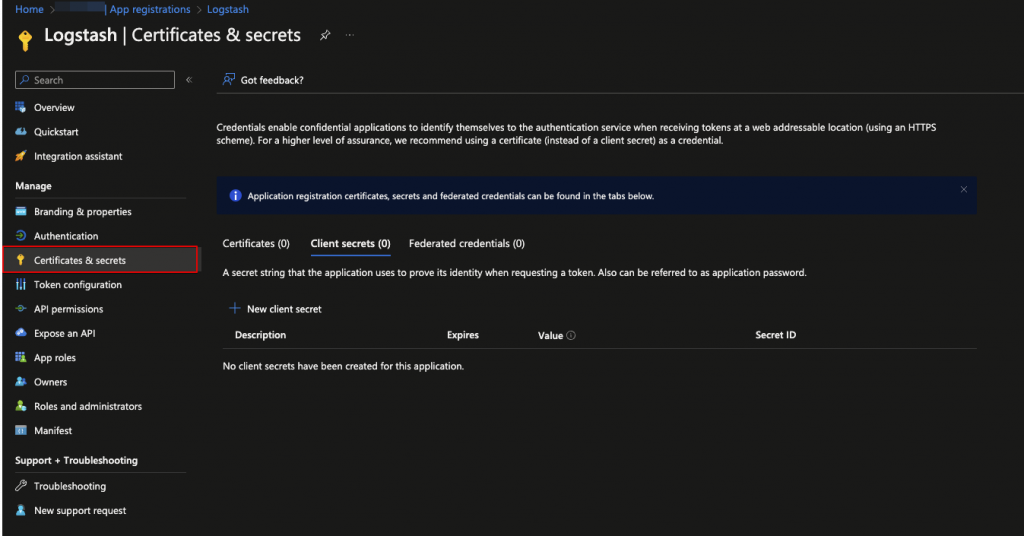
From the new application screen select Certificates & Secrets > Client Secrets > New Client Secret to create a new app password.
Ensure you make a note of the Value as this won’t be shown again and it’ll need to be added to the Logstash configuration.
Before exiting the App Registration page also make a note of the Application (Client) ID and Directory (Tenant) ID values, as these will also be needed in the Logstash configuration.
Data Collection Endpoint (DCE)
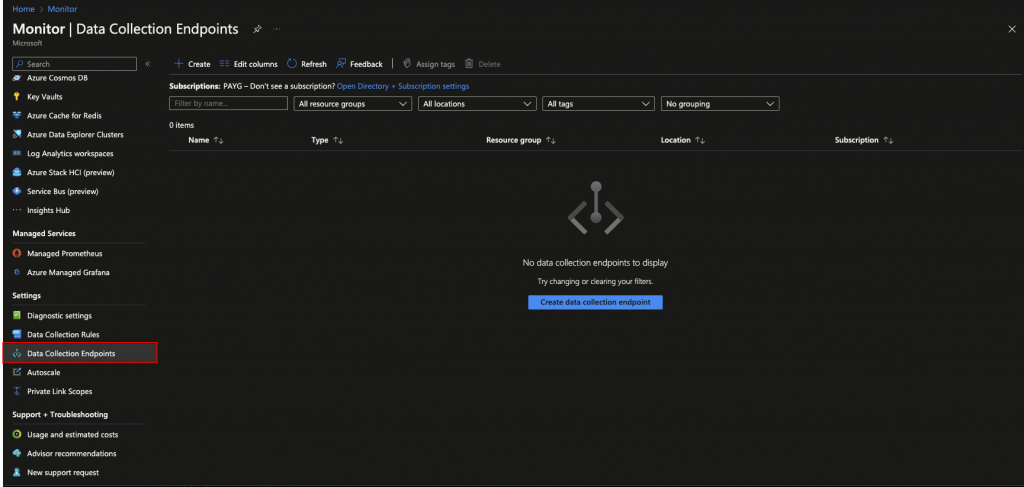
From within the Azure portal navigate to Monitor. Select from the side menu select Data Collection Endpoints > Create.
Give the DCE a name and make sure it’s situated in the same region as the Log Analytics Workspace.
Once the DCE is created, make a note of the Logs Ingestion URL as this will need to be added to the Logstash configuration.
Table Schema – Add Custom Table
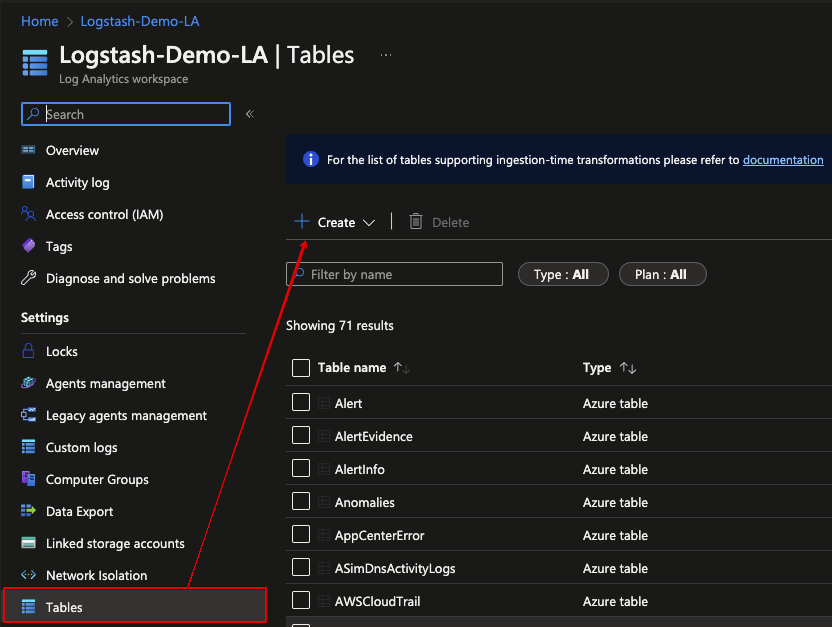
From within the Azure Portal open the Log Analytics workspace you previously created (see this post for further details) and select Tables > Create > New Custom Log (DCR-based) from the menu.
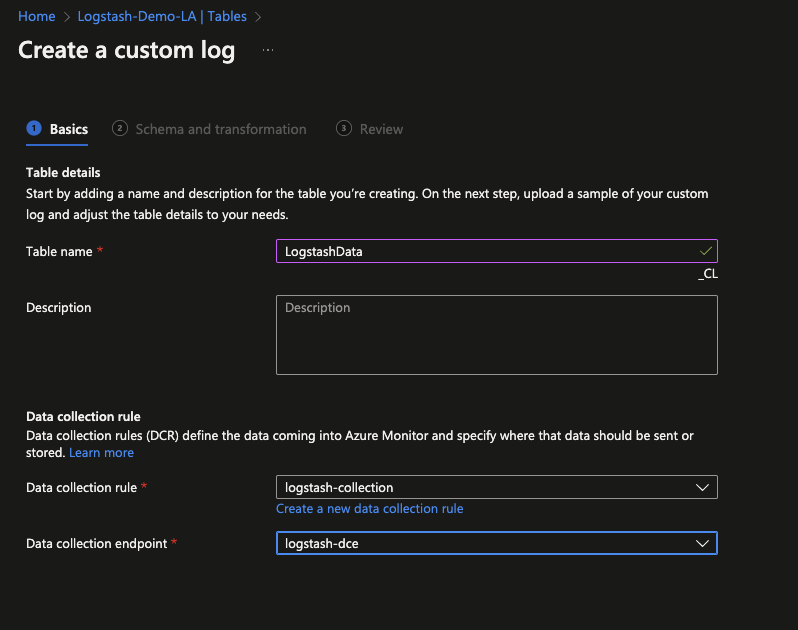
During table creation it is also possible to create a new Data Collection Rule (DCR) and to ‘link’ this to the previously created Data Collection Endpoint (DCE)…
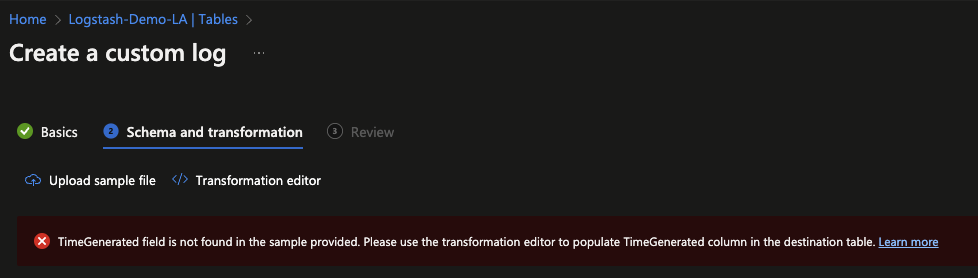
Once complete, it’s now time to upload the previously created sample JSON file as previously generated in Logstash (step 1 of this walkthrough).
If your dataset includes data from Elastic beat agents, you, like me, will likely have to tell the wizard which field it denotes or is to be mapped to the TimeGenerated field.
In this instance I used the following KQL to make the required alterations.
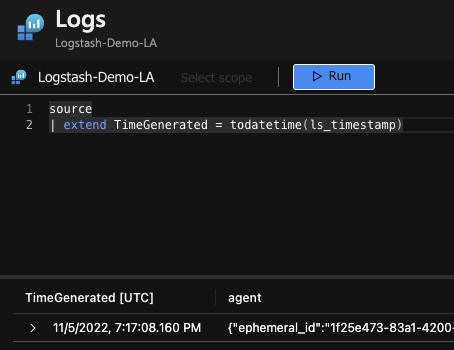
Assuming all goes well, complete the process and save the table configuration.
Data Collection & IAM
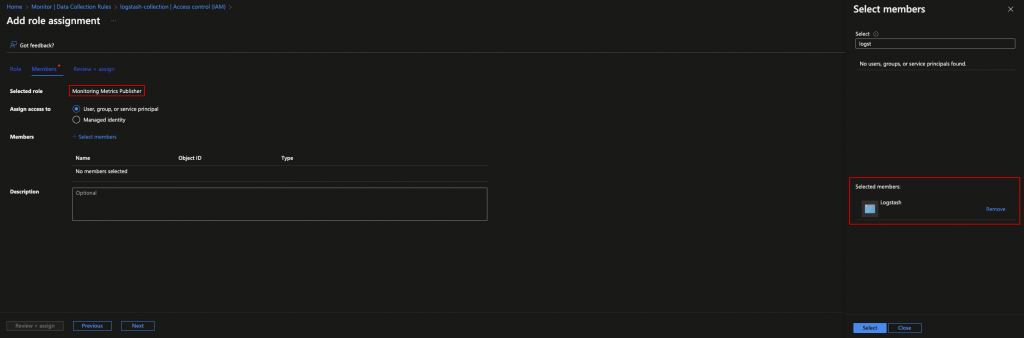
From within the Azure portal, navigate to Monitor > Data Collection Rules > Your Rule > Access Control (IAM) > Add > Add Role Assignment.
From the role selection screen choose Monitoring Metrics Publisher and assign this to the Application you previously created.
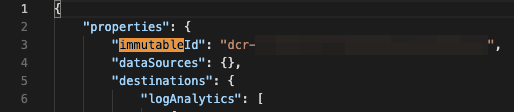
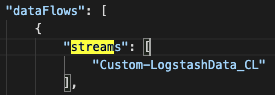
After confirming your selection and before navigating away from the DCR screen, select Overview > JSON View, search for immutableId and the dataflow stream name. Copy each value as these will be needed for the Logstash configuration.
Final Logstash Configuration Additions
Return to the Logstash server and make configuration changes.
sudo vi /etc/logstash/conf.d/ms.confCreate a new output filter that includes:
- Client App ID
- Client App Secret
- Tenant ID
- DCE (https address)
- DCR Immutable ID
- DCR Stream Name
The Logstash configuration for completeness.
input {
        beats {
                port => 5044
                ssl => true
                ssl_certificate_authorities => ["/etc/logstash/certs/ca.crt"]
                ssl_certificate => "/etc/logstash/certs/logstash-demo.crt"
                ssl_key => "/etc/logstash/certs/logstash-demo.pkcs8.key"
                ssl_verify_mode => "force_peer"
              }
      }

output {
        microsoft-sentinel-logstash-output-plugin {
                client_app_Id => "xxxxxx"
                client_app_secret => "xxxxxx"
                tenant_id => "xxxxxx"
                data_collection_endpoint => "https://xxxxxx.eastus-1.ingest.monitor.azure.com"
                dcr_immutable_id => "dcr-xxxxxx"
                dcr_stream_name => "Custom-LogstashData_CL"
                }
      }
Start or restart the Logstash service and tail the Syslog to check for issues.
sudo systemctl restart logstash.service
tail -f /var/log/syslog
It’s worth noting that configuration changes on Azure can (and did in my case) take some time, so you may see HTTP 403 errors similar to the below.

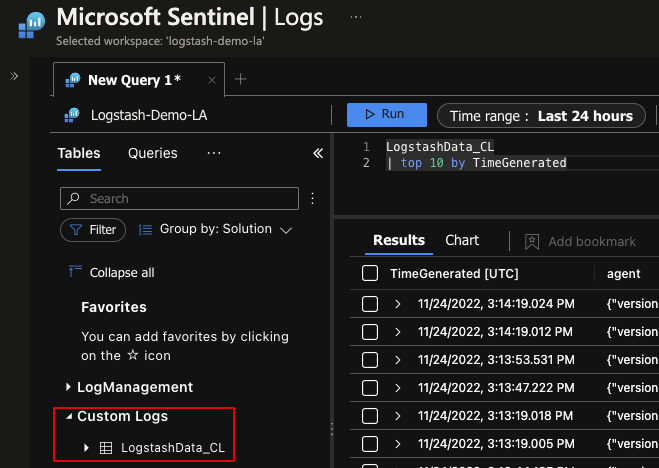
After ~30 minutes I did see data eventually flow from the Logstash server into Microsoft Sentinel.
As always with something this new, there will likely be many changes in upcoming releases, after all this is only just in preview!
We’ll revisit our Logstash journey in an upcoming third instalment, but for now happy hunting!
About In.security.
In.security was formed by Will and Owen, two cyber security specialists driven to help other organisations stay safe and secure against cyber threats and attacks. After having worked together since 2011 in several former companies, they each gained considerable experience in system/network administration, digital forensics, penetration testing plus training. Based in Cambridgeshire, but operating nationally, we can provide a range of services and training for businesses and individuals alike. Read more about our services below:
- Penetration testing
- Vulnerability assessments
- Build reviews
- Red team testing
- Phishing assessments
- Password auditing
- Cloud security auditing